Creating Data Visualizations and Integrating with BI
Introduction
Waii provides powerful apis for creating and integrating data visualizations into your applications.
APIs
Waii simplifies generating chart specifications for integration with BI tools. You can use the Chat API or Chart API to create visualizations:
- Chat API: Supports conversational interactions and handles both chart-related and general queries.
- Chart API: Focused on generating chart specifications based on specific parameters.
The Chat API enables interaction with a SQL chatbot, allowing conversational querying of databases along with data visualizations
Refer to SDK to get started
https://doc.waii.ai/python/docs/chat-module
https://doc.waii.ai/java/docs/chat-module
https://doc.waii.ai/js/docs/chat-module
Using Chat API
This api allows sending a message to the chatbot, which can answer questions, generate SQL queries, or create visualizations.
Key Parameters:
ask: The question for the chatbot (e.g., "How many tables are there?").parent_uuid: The UUID of a previous chat message for follow-up questions.chart_type: Currently waii supports vegalite, superset and metabase
Response:
The response includes:
response: A templated answer to the question.chat_uuid: The UUID of the response for continuing the conversation.is_new: Indicates if the query is a new SQL or a tweak of the previous one.timestamp: The timestamp of the response.response_data: Includes:semantic_context: Related semantic context from the database.catalog: Related tables, if any.sql: The generated SQL query.data: The query result if it was executed.chart_spec: Chart spec based on chart type
Using Chart API
This API allows creating visualizations from SQL data. It supports both creating new charts and tweaking existing ones.
Parameters:
df: A DataFrame containing the data to plot.ask: A question or instruction describing the desired chart and preferences.chart_type: Specifies the chart type. Currently waii supports vegalite, superset and metabase
Examples
1. Create a New Visualization
Generate a chart from a SQL query:
from waii_sdk_py.query import RunQueryRequest

# Activate the database connection
WAII.Database.activate_connection("snowflake://...&warehouse=COMPUTE_WH")

# Run a query and generate a chart
query = "SELECT year, revenue FROM sales_data ORDER BY year"
run_query_response = WAII.Query.run(RunQueryRequest(ask=query))
chart = WAII.Chart.generate_chart(
    df=run_query_response.to_pandas_df(),
    ask="Draw a bar graph showing revenue per year",
    sql=query,
    chart_type=ChartType.METABASE # or ChartType.SUPERSET or ChartType.VEGALITE
)
2. Ask a Chart related question to chatbot
Ask the chatbot - Draw a bar graph showing revenue per year:
response = WAII.Chat.chat_message(ChatRequest(ask="Draw a bar graph showing revenue per year", chart_type = ChartType.METABASE ))
Supported Chart Types:
Currently waii supports vegalite, superset and metabase
Vegalite Chart
Request:
response = WAII.Chat.chat_message(ChatRequest(ask="Draw a bar graph showing revenue per year", chart_type = ChartType.VEGALITE ))
Response:
\{
    "response": "Here is a bar graph showing the total revenue per year for movies released after 1980: \n\n<chart>",

    "response_data": {
        "data": \{
            "rows": [
                \{
                    "START_YEAR": 1981,
                    "TOTAL_REVENUE": 195312802
                \},
                \{
                    "START_YEAR": 1982,
                    "TOTAL_REVENUE": 439506293
                \}
            ],
            "more_rows": 0,
            "column_definitions": [
                \{
                    "name": "START_YEAR",
                    "type": "FIXED"
                \},
                \{
                    "name": "TOTAL_REVENUE",
                    "type": "FIXED"
                \}
            ],
            "query_uuid": "beef22fc-0a96-4688-bf4f-9c53df55f72c"
        \},
        "query": \{
            "query": "SELECT\n    start_year,\n    SUM(revenue) AS total_revenue\nFROM movie_db.movies_and_tv.movies\nWHERE\n    start_year > 1980\nGROUP BY\n    start_year\nORDER BY\n    start_year\n",
            \}
        \},
        "chart": \{
            "uuid": "0b86e535-2e20-42ad-ba0f-95f56f6cf1a5",
            "chart_spec": \{
                "spec_type": "vegalite",
                "chart": "\{\"$schema\":\"https://vega.github.io/schema/vega-lite/v5.json\",\"data\":\{\"url\":\"waii_data.json\"\},\"mark\":\"bar\",\"encoding\":\{\"x\":\{\"field\":\"START_YEAR\",\"type\":\"ordinal\",\"axis\":\{\"title\":\"Start Year\",\"labelAngle\":45\}\},\"y\":\{\"field\":\"TOTAL_REVENUE\",\"type\":\"quantitative\",\"axis\":\{\"title\":\"Total Revenue\",\"grid\":true\}\}\},\"tooltip\":[\{\"field\":\"START_YEAR\",\"type\":\"ordinal\",\"title\":\"Year\"\},\{\"field\":\"TOTAL_REVENUE\",\"type\":\"quantitative\",\"title\":\"Revenue\"\}]\}"
            \}
        \}
    \}
You can get the vegalite chart specs using
response.response_data.chart.chart_spec
for the above example the chart spec are as follows:
\{
  "$schema": "https://vega.github.io/schema/vega-lite/v5.json",
  "data": \{
    "url": "waii_data.json"
  \},
  "mark": "bar",
  "encoding": \{
    "x": \{
      "field": "START_YEAR",
      "type": "ordinal",
      "axis": \{
        "title": "Start Year",
        "labelAngle": 45
      \}
    \},
    "y": \{
      "field": "TOTAL_REVENUE",
      "type": "quantitative",
      "axis": \{
        "title": "Total Revenue",
        "grid": true
      \}
    \}
  \},
  "tooltip": [
    \{
      "field": "START_YEAR",
      "type": "ordinal",
      "title": "Year"
    \},
    \{
      "field": "TOTAL_REVENUE",
      "type": "quantitative",
      "title": "Revenue"
    \}
  ]
\}
You would need to replace data in the above to view the actual chart i.e.,
response.response_data.chart.chart_spec.data = \{
    "values":
    response.response_data.data.rows
 \}
Actual chart:
Open the Chart in the Vega Editor
Superset Chart
Request:
response = WAII.Chat.chat_message(ChatRequest(ask="Draw a bar graph showing revenue per year", chart_type = ChartType.SUPERSET ))
Response:
\{
 "response_data": \{
        "data": \{
            "rows": [
                \{
                    "START_YEAR": 2015,
                    "TOTAL_REVENUE": 11987590461
                \},
                \{
                    "START_YEAR": 2016,
                    "TOTAL_REVENUE": 8735916896
                \}
            ],
            "more_rows": 0,
            "column_definitions": [
                \{
                    "name": "START_YEAR",
                    "type": "FIXED",
                \},
                \{
                    "name": "TOTAL_REVENUE",
                    "type": "FIXED"
                \}
            ],
            "query_uuid": "14b6f72e-7379-4a34-8d57-661a2b6f8964"
        \},
        "query": \{
            "query": "SELECT\n    start_year,\n    SUM(revenue) AS total_revenue\nFROM movie_db.movies_and_tv.movies\nGROUP BY\n    start_year\nORDER BY\n    start_year\n"
        \},
        "chart": \{
            "uuid": "489ab1f2-f4e2-4bd3-9e66-b758e97451cb",
            "chart_spec": \{
                "spec_type": "superset",
                "generation_message": null,
                "chart_title": "Total Revenue Per Year",
                "superset_specs": \{
                    "datasource": "",
                    "viz_type": "echarts_timeseries_bar",
                    "y_axis_title_margin": 40,
                    "color_scheme": "d3Category10",
                    "x_axis": "START_YEAR",
                    "metrics": [
                        \{
                            "expressionType": "SQL",
                            "sqlExpression": "SUM(TOTAL_REVENUE)",
                            "label": "SUM(TOTAL_REVENUE)"
                        \}
                    ],
                    "y_axis_title": "SUM(TOTAL_REVENUE)"
                \}
            \}
        \}
    \}
\}
To create chart in superset, you would need to first create dataset in superset using /api/v1/dataset/ api
Here's simple script:
    dataset = self.client.post(f"\{self.client.host\}/api/v1/dataset/", json=\{
        "database": database_id,
        "sql": sql_query,
        "table_name": dataset_name,
        "normalize_columns": True
    \})
you can get the sql_query from response.response_data.query.query
After creating dataset you can pass these specs to /api/v1/explore/permalink
Note: You would need to replace "datasource": "", with the dataset id you get in previous step
Here's simple script to do that:
superset_specs["datasource"] = f"{dataset_id}__table" permlink_payload = { "formData": superset_specs }
permlink = self.client.post(f"{self.client.host}/api/v1/explore/permalink", json=permlink_payload)
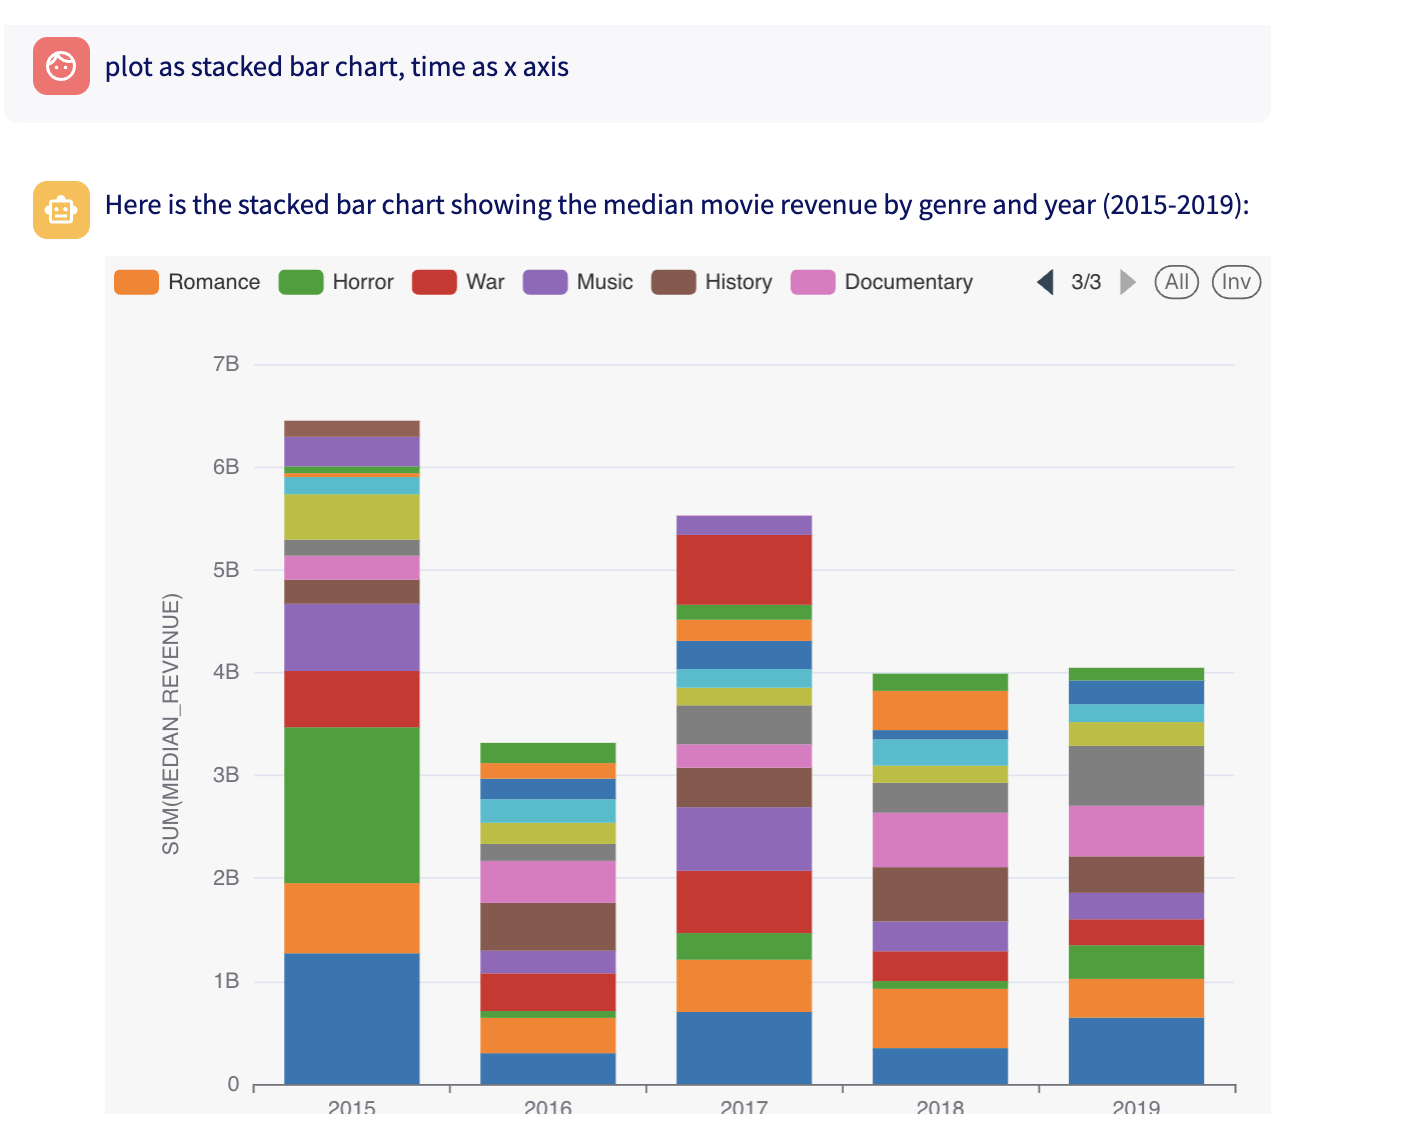
permlink will have the superset url which you can embed in your application. Here's an example chart
Superset example chart superset chart embedded in streamlit app:
