Using Waii with Jupyter
Waii can be used in your favourite notebook environment, let's take an example with Jupyter Notebook.
Use Jupyter Notebook
First, you need to install Jupyter Notebook. You can follow the official documentation or use the following command:
pip install notebook
Launch Jupyter Notebook:
jupyter notebook
If you want to use Jupyter in a virtual environment, you can follow this guide
Install Waii
Inside your notebook, you can install Waii with the following command:
!pip install waii-sdk-py
!pip install pandas
Import Waii
from waii_sdk_py import WAII
from waii_sdk_py.chat import *
from waii_sdk_py.query import *
from waii_sdk_py.database import *
from waii_sdk_py.semantic_context import *
from waii_sdk_py.chart import *

WAII.initialize(url="https://your-waii-instance/api/", api_key="your-api-key")

# show all the connections available
print([conn.key for conn in WAII.Database.get_connections().connectors])

# activate the connection you want to use, use one of the keys from the previous command
# This is optional if you only want to use our preloaded playground connection
WAII.Database.activate_connection('snowflake://...')
Create pandas dataframe from Snowflake query
First, let's try to generate a query from a question give me most popular language for each country:
print(WAII.Query.generate(QueryGenerationRequest(ask = "give me most popular language for each country")).query)
You will see the following output:
WITH language_percentage AS (
    SELECT
        name AS country,
        language,
        SUM(percentage) AS total_percentage
    FROM waii.world.countrylanguage AS l
    INNER JOIN waii.world.country AS c
        ON countrycode = code
    GROUP BY
        name,
        language
)

SELECT
    country,
    language
FROM (
    SELECT
        country,
        language,
        ROW_NUMBER() OVER (PARTITION BY country ORDER BY total_percentage DESC) AS rn
    FROM language_percentage
)
WHERE
    rn = 1
You can simply add .run() to execute the query and get the result as a pandas dataframe:
df = WAII.Query.generate(QueryGenerationRequest(ask = "give me most popular language for each country")).run().to_pandas_df()
display(df)
You should be able to see result like this:

Plot the result
WAII.Query.plot(df, "plot number of countries for each language")

Use map to visualize the result
Let's look at another example, this time we will use a map to visualize the result.
df = WAII.Query.generate(QueryGenerationRequest(ask = "Give me all cars, with their maker, country and continent")).run().to_pandas_df()
display(df)
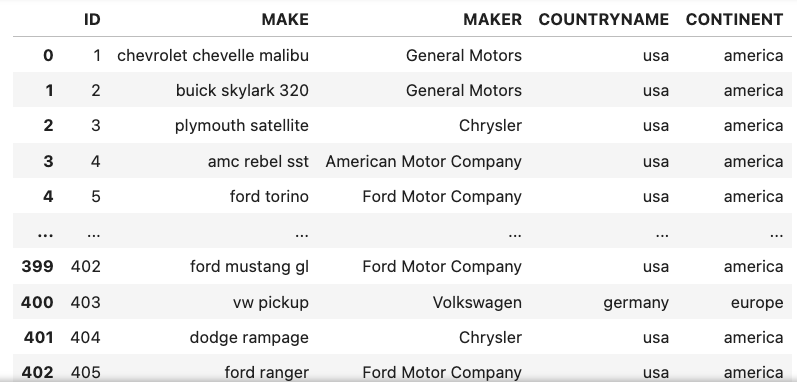
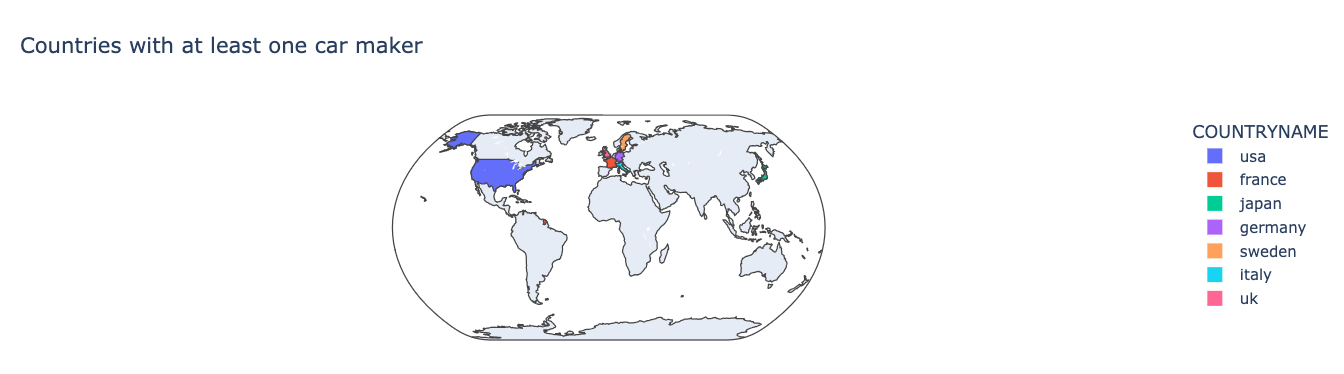
Plot it on a map:
WAII.Query.plot(df, "use world map to show me all the countries which have at least one car maker")
Get script for the plot
If you want to use the plot in your own code, or debug when something goes wrong. You can add return_plot_script=True to the plot function:
code = WAII.Query.plot(df, "use world map to show me all the countries which have at least one car maker", return_plot_script=True)
print(code)
You can see the following output:
import pandas as pd
import plotly.express as px

# Assuming 'df' is your DataFrame and 'COUNTRYNAME' is the column with country names
df_unique_countries = df.drop_duplicates(subset=['COUNTRYNAME'])

fig = px.choropleth(df_unique_countries, locations='COUNTRYNAME',
                    locationmode='country names',
                    color='COUNTRYNAME',
                    title='Countries with at least one car maker',
                    hover_name='COUNTRYNAME',
                    projection='natural earth')

fig.show()
Example notebook
You can find a full example notebook here.