Using Waii with Google Colab
Go to https://colab.google/ Click "New Notebook" on the top-right corner
Add api-key secret
On the left panel, click the "key" icon

Then enter the WAII API Key (which you get from WAII UI, click hamburger menu on the top-right corner, and click "Copy API Key").
NOTE: This is not OPENAI_API_KEY! You need get access to Waii first to get the API Key. (Contact us at https://waii.ai/)

Install dependencies
!pip install waii-sdk-py
Import waii-sdk-py, and use API key
import pandas as pd
import numpy as np
import plotly.express as px

from waii_sdk_py import WAII
from waii_sdk_py.query import *

from google.colab import userdata
api_key = userdata.get('waii_api_key')

WAII.initialize(url='https://tweakit.waii.ai/api/', api_key=api_key)
Get all connectors, generate query, and show chart
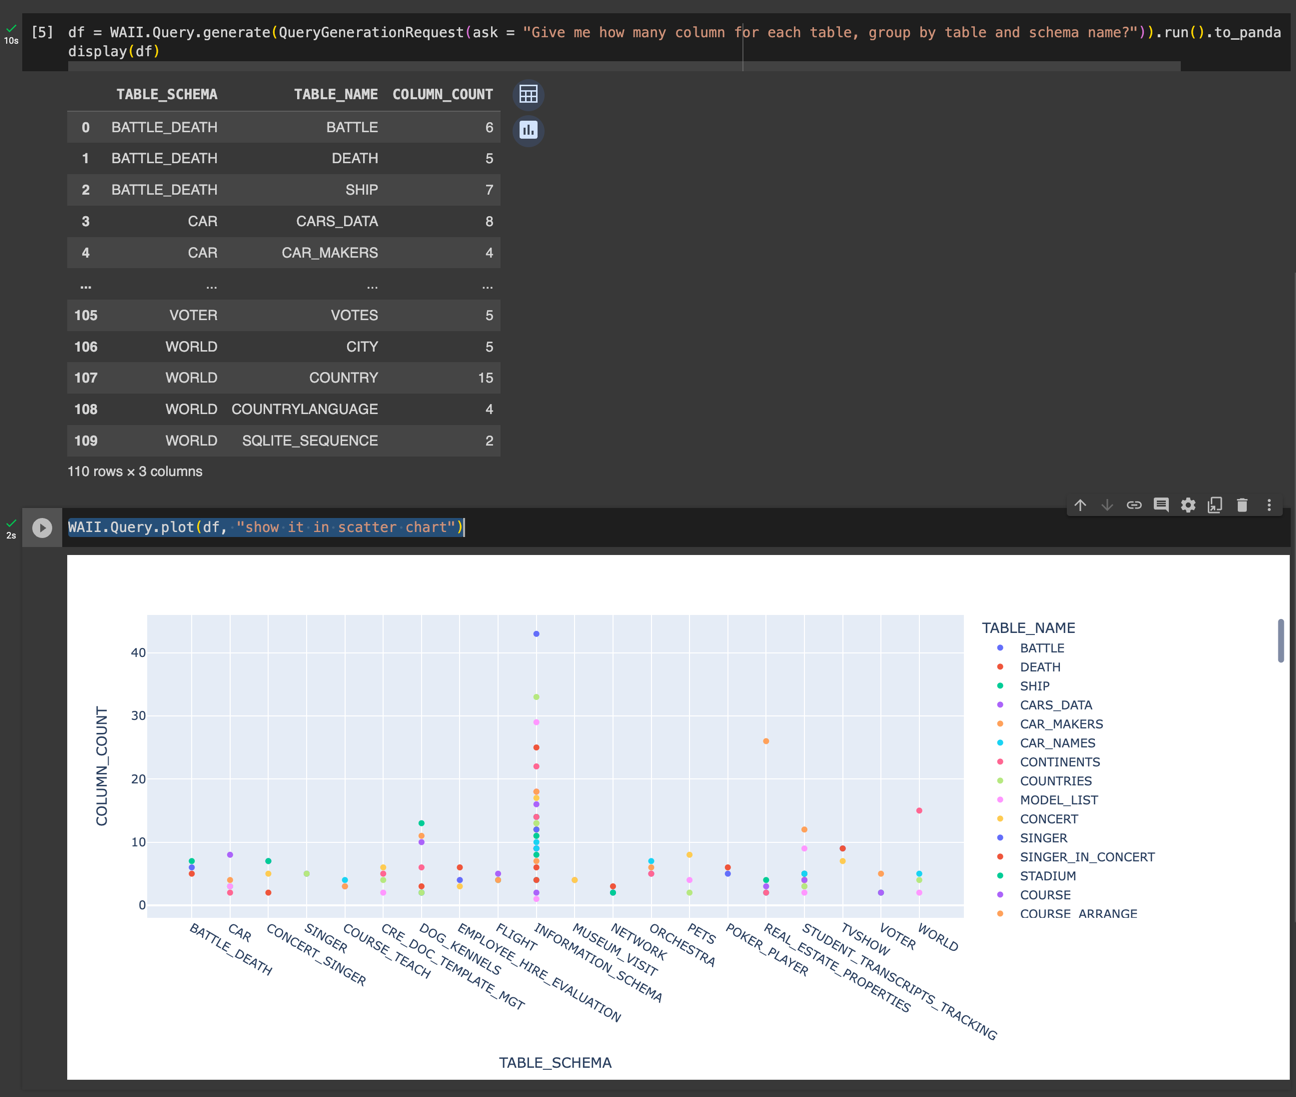
df = WAII.Query.generate(QueryGenerationRequest(ask = "Give me how many column for each table, group by table and schema name?")).run().to_pandas_df()
display(df)
WAII.Query.plot(df, "show it in scatter chart")
You should be able to see the result like
Upload CSV and plot
Use this code to upload CSV file
# upload csv and try
from google.colab import files
uploaded = files.upload()
Click Choose Files button, and select the CSV file to upload
Once it is done, you can use
df = pd.read_csv('<the file name you just uploaded, such as flight-data.csv>')
df.head()
After that, you can just use WAII.Query.plot to plot the chart
WAII.Query.plot(df, "show me number of flights by month")